Type:Logic ICs
Condition:New
No.:FM59
Decoration and construction content:Hydropower project
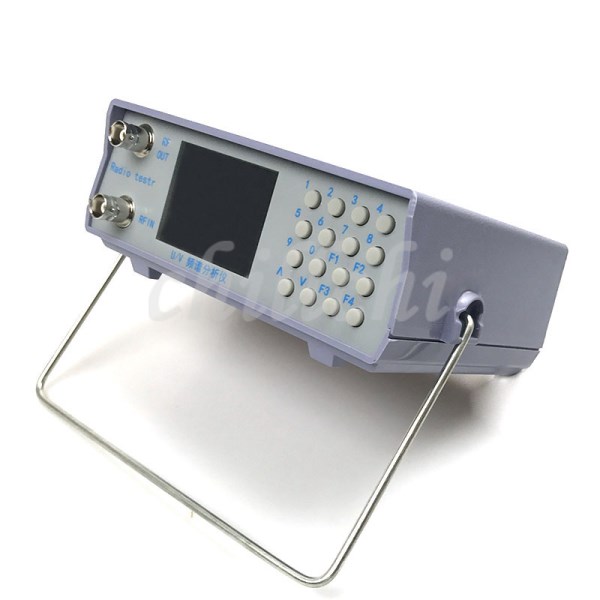
UV band tracking source of simple spectrum analyzer
1. frequency range: 136-173MHz and 400-470MHz
2. spectrum dynamic range: -127dBm to 0dBm
3. resolution: 1dB
4. tracking source output power: about -38 dBm
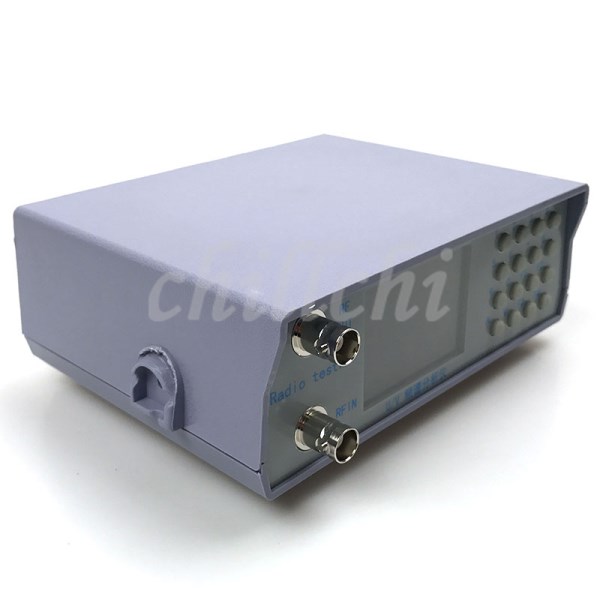
5. interface: BNC-F
6. power supply: need external DC 8-12V
7. the machine does not bring the power supply, without the test line, without paper instructions, the specific operation of the page can be introduced.
The operation method is as follows:
The upper right display spectrum is a spectrum pattern, showing tracking as a spectrum plus tracking mode
The first line shows the center frequency center frequency power
The second lines capture the strongest or weakest frequency or the specified frequency and power (The capture time spectrum mode is used to capture the strongest signal frequency, the spectrum plus tracking mode to capture the weakest signal frequency, and to display the fixed time, any mode is displayed to specify (the specified method reference).Adjust the operation steps of the diplexer") frequency point and power)
Third line frequency range (center frequency positive and negative) frequency step
F1: the frequency, frequency range, step cycle selection of the cursor mobile center (Long press can switch between spectrum and tracking mode)
F2: backspace key
The cursor points to the center frequency: the digital key is directly input or up and down to adjust the frequency step by step
F3 F4 adjusts the frequency in units of 1M
The cursor points to the frequency range: the value is the center frequency as the center positive and negative range. Example: 0128000 is the center positive and negative 12.8 M
The 25.6M range
The number key directly inputs the upper and lower keys to double the range,
The cursor points to step: the digital key is directly input or the up and down key is adjusted by 5KWhen the step is changed, the scan range will be slightly changed to fit the size of the grid
Q1: What Is Your Product Warranty?
A: We Guarantee Our Product Is Fit For Its Normal User Purposes And Is Free From Defects In Materials Or Workmanship.
Q2: What Is Your Company Policy On Defective Goods?
A: Our Company Keep Items Quality For A Long Time. If There Are Any Defective Goods Due To
Production Defects Or Transportation Problem, Please Contact Us. Our Customer Service Team Will Provide Immediate Response To
Complaints. We Will Try Our Best To Give You A Good Resolve Way.
Q3: What Is Your MOQ (minimum Order Quantity)?
A: Generally Our Moq Is No Limited. Please Have More Discussion With Us If Your Combination Of Models Is Complicated.
Q4:how About Getting Samples From You?
A: We Will Send You The Samples After We Receive The Payment For Samples. The Buyer Shall Afford The Shipping Cost. Please Have A
Confirm With Us Which Shipping Way Do You Want.
Q5:about The Shipment: What Type Of Shipment Will You Use?
A: We Usually Ship The Products By Express(delivery It To Your Door) Or By Air Freight To Your Nearest Airport, Shipping Days:3-7
Working Days Depend On Destination;if The Order Quantity Is Large, We May Ship By Sea Container And The Best Ship Way Is By Sea,
Shipping Days: Over 20 Working Days Depend On Destination Port.
Q6:what Packing Do You Use?
A: Neutral Package With Airbag Or Customized Package.
Q7:how Much Are The Shipping Cost?
A:shipping Cost Is Charged By The Package's Weight And Related To The Shipping Methods You Choose And Your Destination.
Q8:how To Order?
Step1.Click (Add to Cart) Buy Directly On The Product Page, Or Add To Shopping Cart And Settle Together, Pay With Paypal,
Need your information, such as full name,country, city, detail address, post code, tax number ...
Step2. We Will Delivery by EMS POST, FedEx or DHL Within
3-5 Working Days After Payment Confirmed.
Setp3. Confirm Us Receipt of Products.

